
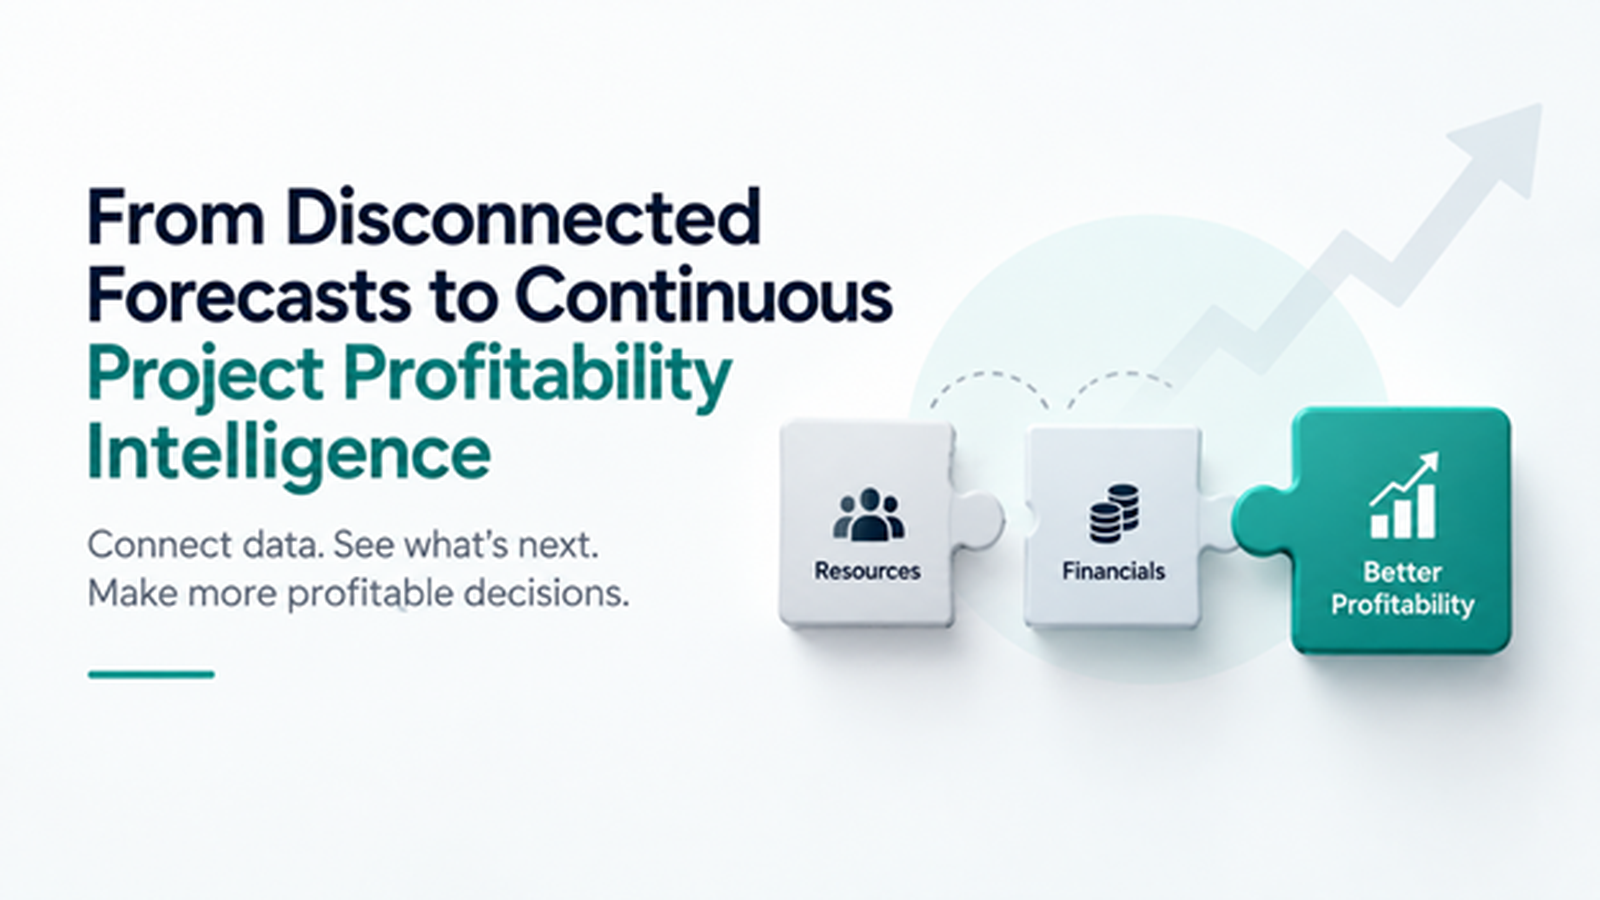
Projects change every day.
People take leave. Allocations move. Scope changes. Delivery estimates increase. Milestones shift. New work arrives. Actual effort replaces planned effort.
Yet in many organizations, the financial forecast remains unchanged until someone manually updates a spreadsheet.
That creates a fundamental mismatch:
Execution is continuous. Forecasting is periodic.
The Problem: Static Forecasts in a Dynamic Business
Traditional forecasts are built from snapshots.
Finance extracts financial data. Resource managers update capacity sheets. Project managers revise delivery plans. Leadership eventually receives a consolidated view.
By the time everything is assembled, some underlying assumptions may already have changed.
This is particularly challenging in services organizations where resource decisions directly affect project cost and where project delays or additional effort can quickly alter profitability.
Whizible describes integrated execution as enabling real-time visibility into project performance and more proactive performance management.
PROJECTS → RESOURCES → TIMESHEETS → COST → REVENUE → PROFITABILITY
with one continuous data flow rather than separate boxes.
The Solution: Create a Continuous Forecasting Loop
Continuous profitability intelligence starts by connecting the operational events that change project economics.
Project progress tells you what is happening.
Resource data tells you who is delivering it.
Timesheets tell you how much effort is actually being consumed.
Financial data tells you what that execution costs and earns.
Forecasting connects all four to answer what is likely to happen next.
This does not mean every small project event requires executive attention. Instead, the system should surface meaningful variance—projects where effort, cost, utilization, schedule or revenue is moving outside expected boundaries.
Whizible brings project lifecycle management, resource optimization, financial controls and analytics into an integrated PSA environment, helping organizations move toward a shared operational view.
Explore the platform at Whizible.
From Reporting to Decision Intelligence
The real value of integration is not having everything on one dashboard.
It is connecting cause and effect.
Resource extension → higher forecast cost → lower expected margin.
Milestone delay → revenue timing change → revised financial outlook.
Unexpected effort → cost variance → potential scope or commercial review.
Once those relationships become visible, forecasting changes from predicting numbers to supporting decisions.
That is the progression organizations should aim for:
Disconnected Data → Connected Forecast → Early Warning → Corrective Action → Better Profitability Control
And that completes the forecasting chain.
For ongoing perspectives on project governance, services execution and business performance, follow Vishwas Mahajan on LinkedIn.
FAQs
What is continuous project forecasting?
It is the practice of updating forward-looking project expectations as underlying execution, resource and financial information changes.
How is profitability intelligence different from financial reporting?
Financial reporting primarily explains recorded performance. Profitability intelligence combines actual and forward-looking information to help teams understand where project economics may be heading.
Which data should be integrated?
Core inputs typically include project plans, allocations, availability, actual effort, timesheets, resource costs, budgets, revenue and billing information.
Does continuous forecasting eliminate monthly financial reviews?
No. It complements formal financial reviews by providing earlier operational signals between reporting cycles.