
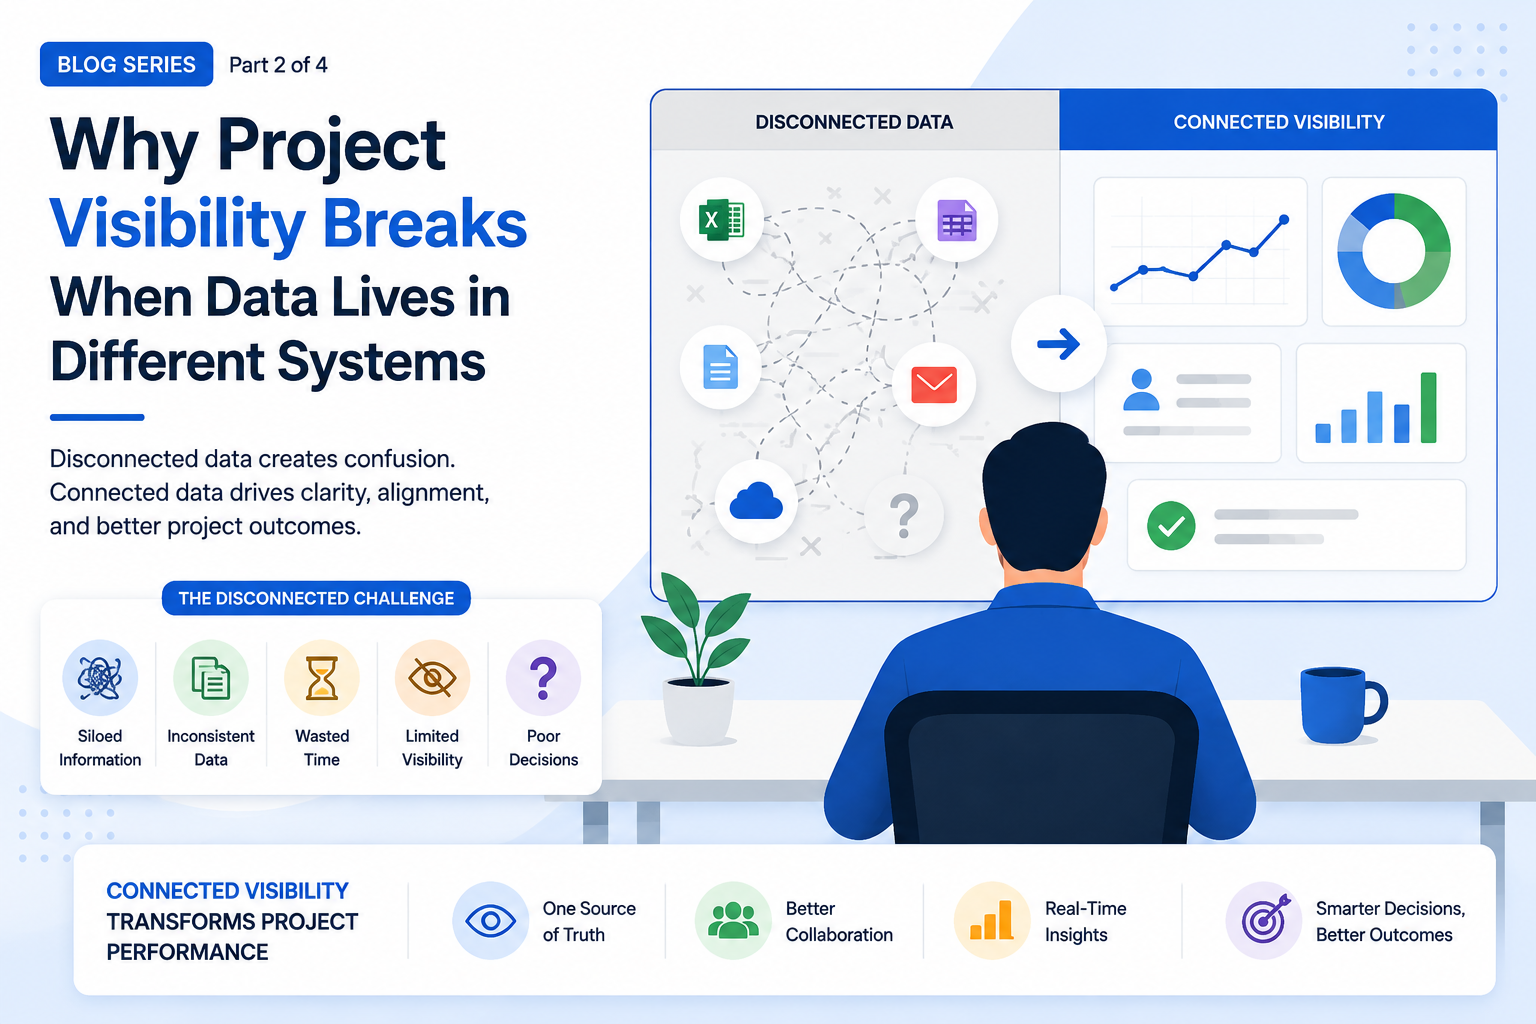
A dashboard can look impressive and still tell yesterday’s story.
That is one of the most overlooked problems in project management.
When project information originates across multiple disconnected applications, reporting becomes an exercise in collecting information before analyzing it.
The Problem: Different Systems Tell Different Versions of the Project.
Imagine leadership sees a project reported as 70% complete.
That number alone sounds encouraging.
But what if the resource management spreadsheet shows two key specialists becoming unavailable next week? What if actual effort recorded through timesheets is already approaching the original budget? What if an approved scope change has not yet reached finance?
The project may still be reported as green even though several early warning signals are already visible elsewhere.
This creates what can be called a visibility gap: the difference between what is actually happening in the project and what decision-makers can currently see.
Reporting Becomes Rear-View Management.
In fragmented environments, PMOs frequently spend considerable effort collecting updates before creating management reports.
By the time the information is validated and presented, conditions may have changed again.
This turns reporting into a retrospective process.
The objective of project visibility should instead be to identify emerging deviations while there is still time to respond.
The Solution: Build Continuous Project Visibility.
Better visibility begins by connecting the information that determines project health:
Progress + Effort + Resources + Cost + Risks + Financials
When these dimensions are available together, leaders can investigate not only what happened, but also why it is happening and what may happen next.
Whizible’s project approach combines operational information with dashboards and reporting capabilities, while its resource management model provides visibility into workload, availability and utilization.
Instead of asking teams to manually create visibility, organizations can make visibility a natural outcome of everyday project execution.
From Reporting to Early Intervention
A connected environment changes management conversations.
Instead of:
“Why did the project exceed its budget?”
leaders can ask:
“Which projects are trending toward budget pressure?”
Instead of:
“Why wasn’t the resource available?”
they can ask:
“Which upcoming projects face capacity constraints?”
That difference is significant. It moves project governance from explanation to intervention.
Read Next
Visibility problems eventually become business problems particularly when resource effort and project economics remain disconnected.
Continue with Blog 3: “How Disconnected Resource and Financial Data Quietly Erodes Project Profitability.”
Related Whizible insight: Smarter Resource Allocation in IT Projects
Explore more perspectives from Dr. Vishwas Mahajan on LinkedIn.
FAQs
-
What causes poor project visibility?
Common causes include fragmented data, delayed timesheets, manually maintained resource plans, inconsistent reporting and financial information separated from project execution.
-
Does having dashboards guarantee real-time visibility?
No. A dashboard is only as current and connected as its underlying information.
-
How does integrated project data improve decision-making?
It allows leaders to view operational, resource and financial signals together, reducing the time required to identify emerging problems.
-
Who benefits most from connected project visibility?
Project managers, PMOs, delivery leaders, resource managers, finance teams and senior leadership all benefit because they can work from more consistent information.