
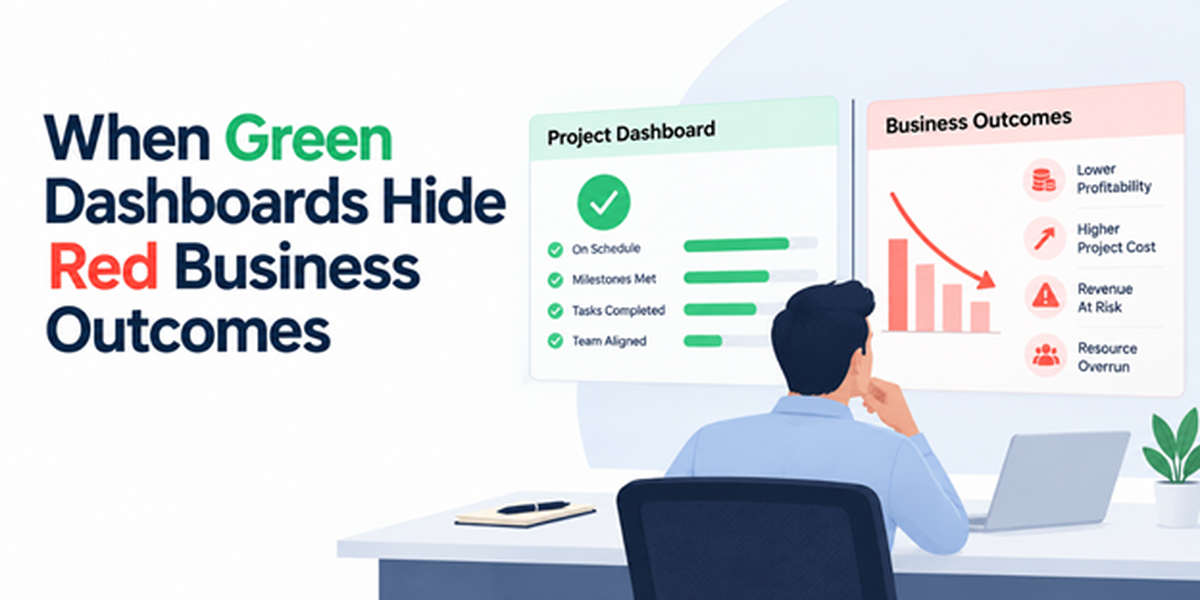
A green project dashboard is reassuring. Milestones are progressing, deadlines appear achievable, and teams are completing their assigned activities.
But does a green project status necessarily mean the business is performing well?
Not always.
In project-driven organizations, operational success and financial success are closely related, but they are not the same thing. A project can meet its delivery commitments while consuming excessive resources, generating lower-than-expected margins, or creating additional financial exposure.
This disconnect is one of the most overlooked consequences of the context gap.
The Problem Project Success Is Often Measured Too Narrowly.
Traditional project reporting focuses heavily on schedules, task completion, and milestone achievement.
While these indicators are essential, they represent only part of the business picture.
Imagine a fixed-price engagement valued at $500,000. The delivery team completes every milestone on time, and the project dashboard remains green throughout execution.
However, additional senior resources, repeated rework, and unapproved scope changes increase delivery costs from the planned $350,000 to $440,000.
PLANNED MARGIN
30%
$150,000 projected profit
ACTUAL MARGIN
12%
$60,000 actual profit
Illustrative scenario, not a reported customer result.
From a delivery perspective, the project succeeded. From a profitability perspective, the outcome was significantly weaker than planned.
The dashboard was not necessarily inaccurate. It simply failed to show the complete business picture.
The Solution Bring Financial Intelligence Into Project Governance.
Organizations need project governance models that evaluate delivery performance alongside financial outcomes.
This requires connecting project schedules, resource allocation, timesheet information, billing milestones, and project costs.
When these elements are reviewed together, leadership can identify early signs of margin erosion rather than discovering financial problems after project completion.
For example, a project manager should be able to recognize when additional effort is consuming the remaining budget faster than planned. Similarly, finance teams should have visibility into delivery progress before evaluating revenue and billing expectations.
Whizible supports this approach by connecting project execution with resource and financial management.
For further reading, explore Whizible’s article on fixed-price contract profitability, which discusses how scope changes, resource allocation, and cost overruns affect project margins.
Measure Project Health Beyond Schedule Performance.
A more complete project health framework should include:
- Planned versus actual project costs.
- Forecasted profitability at completion.
- Resource effort against approved budgets.
- Scope changes and their commercial implications.
- Billing readiness and potential revenue leakage.
These indicators help leadership distinguish between projects that are merely progressing and projects that are creating sustainable business value.
Conclusion
A green dashboard should represent more than completed activities and achievable deadlines.
It should give leaders confidence that delivery commitments, resource investments, and financial outcomes remain aligned.
Without this connection, organizations risk celebrating operational success while overlooking declining profitability.
Explore additional perspectives on business-driven project governance from Dr. Vishwas Mahajan.
CTA: Is your project dashboard showing delivery progress or the true financial health of your projects?
Discover how Whizible connects project execution and financial visibility.
FAQs
Q1. Can a project be successful but unprofitable?
Yes. A project may meet its delivery commitments while exceeding planned costs or absorbing unbilled work, reducing profitability.
Q2. Which financial metrics should project dashboards include?
Useful metrics include budget variance, actual costs, forecasted margins, billable effort, and billing status.
Q3. How does integrated project reporting improve financial governance?
It allows delivery and finance teams to evaluate operational progress and financial performance together, supporting earlier corrective action.