
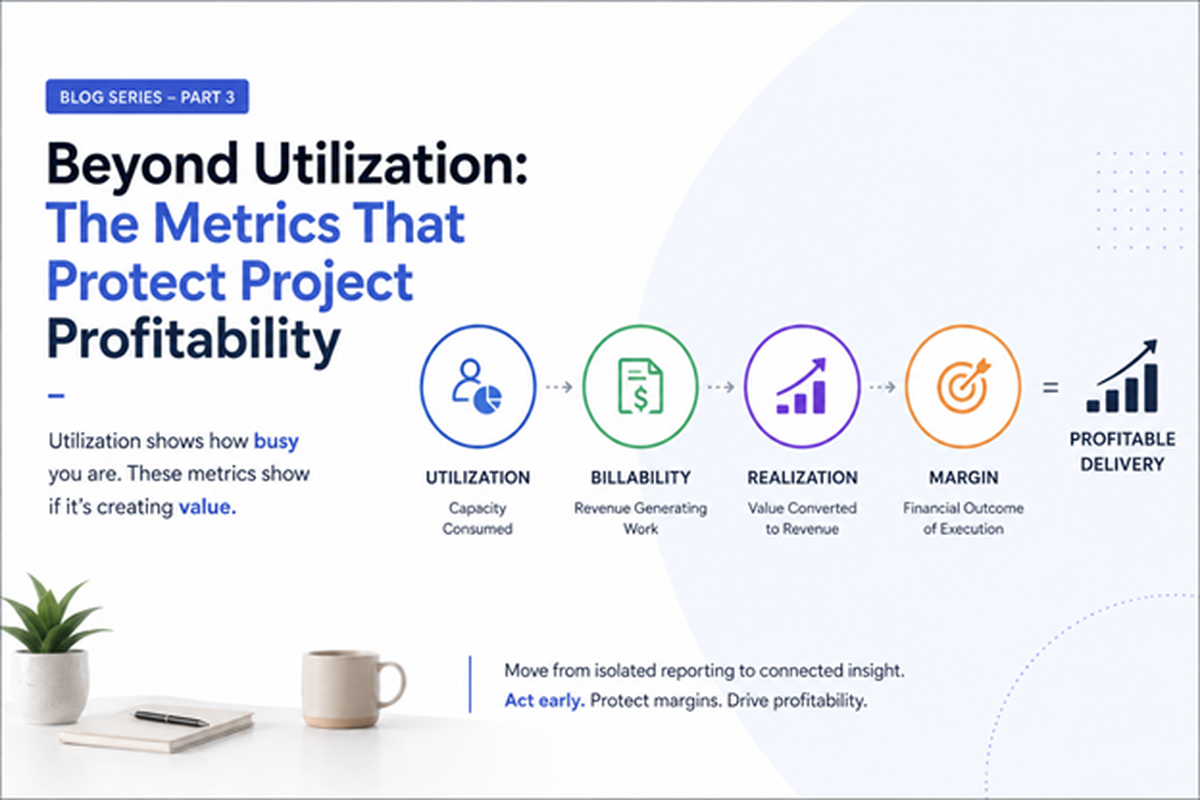
Stop Asking Only “Are Our People Busy?”
Once organizations understand the hidden cost behind utilization, the next step is improving what they measure.
A utilization percentage answers one useful question: How much available capacity is being consumed?
It does not answer:
Are we making enough money from that capacity?
That requires a broader profitability scorecard.
Whizible’s financial-metrics material itself identifies bench, utilization rate and realization rate as operational metrics relevant to identifying profit leakage.
Four Metrics That Give Utilization Context.
Billable utilization helps distinguish revenue-generating activity from total activity.
Realization rate indicates how effectively recorded or expected billable value translates into actual commercial value.
Effort variance reveals whether projects are consuming more hours than planned.
Project margin ultimately connects revenue and delivery cost, helping leadership understand whether execution is creating the expected financial return.
Individually, each metric provides one part of the story.
Together, they reveal whether resource capacity is being converted into profitable delivery.
The Problem With Disconnected Reporting.
In many organizations, PMO tracks project schedules, HR maintains resource information, employees submit timesheets elsewhere, and Finance calculates profitability separately.
By the time those numbers are reconciled, the project may already have absorbed weeks of excess effort.
The solution isn’t another report.
It is a connected operational model where changes in effort, allocation and cost become visible alongside their financial consequences.
Accurate timesheets are part of that foundation because work-hour information helps organizations understand resource consumption and project economics. Whizible’s guidance describes time tracking as relevant to resource optimization and project profitability.
Moving From Reporting to Early Intervention
Imagine that a project’s utilization remains at 88%.
Traditionally, nothing appears wrong.
But a connected profitability view might simultaneously show:
Actual effort: 14% above plan
Realization: declining
Resource cost: increasing
Forecast margin: falling
Now management can intervene before month-end rather than explain the variance afterward.
That is the real value of connected project financial visibility.
Whizible brings project, resource, time and financial information into an integrated PSA environment so leaders can move beyond isolated operational metrics.
FAQs
-
What is the difference between utilization and realization?
Utilization measures how much resource capacity is being used, while realization helps evaluate how effectively billable work translates into commercial value.
-
Which KPI is most important for profitability?
There is no single KPI. Project margin needs context from utilization, billability, realization, cost and effort variance.
-
How often should profitability be monitored?
For active projects, profitability indicators should be reviewed frequently enough to allow intervention before significant margin erosion occurs rather than relying solely on month-end analysis.
A utilization number tells you how busy your organization is. A connected financial view tells you whether that busyness is creating value.
Discover Whizible’s integrated PSA platform and follow Vishwas Mahajan for more perspectives on project and resource governance.
Next in the series → Building a Resource Strategy That Optimizes Profitability, Not Just Utilization